Loading page…
Notes to Infographic
AI Generator
Paste meeting notes, a study guide or a brief. Get a finished infographic in about thirty seconds. Your first one is free, no sign-up needed.
Paste your notes
Anything from a meeting recap to a lecture. Pick a style, press Generate, and the poster downloads in about thirty seconds.
Supports paste, typing, or .txt/.md file drop
579 / 5,000How to use Notes to Infographic
Turn notes into an infographic image. Group your main points so they are easy to read.
Paste your notes. Keep the main facts and remove repeated points.
Choose a style. Add any details you want the image to include.
Generate the image. Check the result, then use the download button.
Example to try
Water cycle: evaporation, condensation and rain. Add simple labels and arrows.
Check the result
Check facts, numbers and spelling against your notes before sharing.
Then edit it, right in the browser
Press Edit on the result and the poster comes apart into blocks you can change. No design tool, no re-prompting.
Move, resize or delete any block
Every title, number, caption and icon is its own object. Drag it, scale it, or remove it and the background fills in.
Retype a number or a title
Double-click a block and type. The new text keeps the block's colour, size and alignment.
Regenerate in the same style
Once the words are right, one click rebuilds the whole poster around them. It counts as a new infographic.
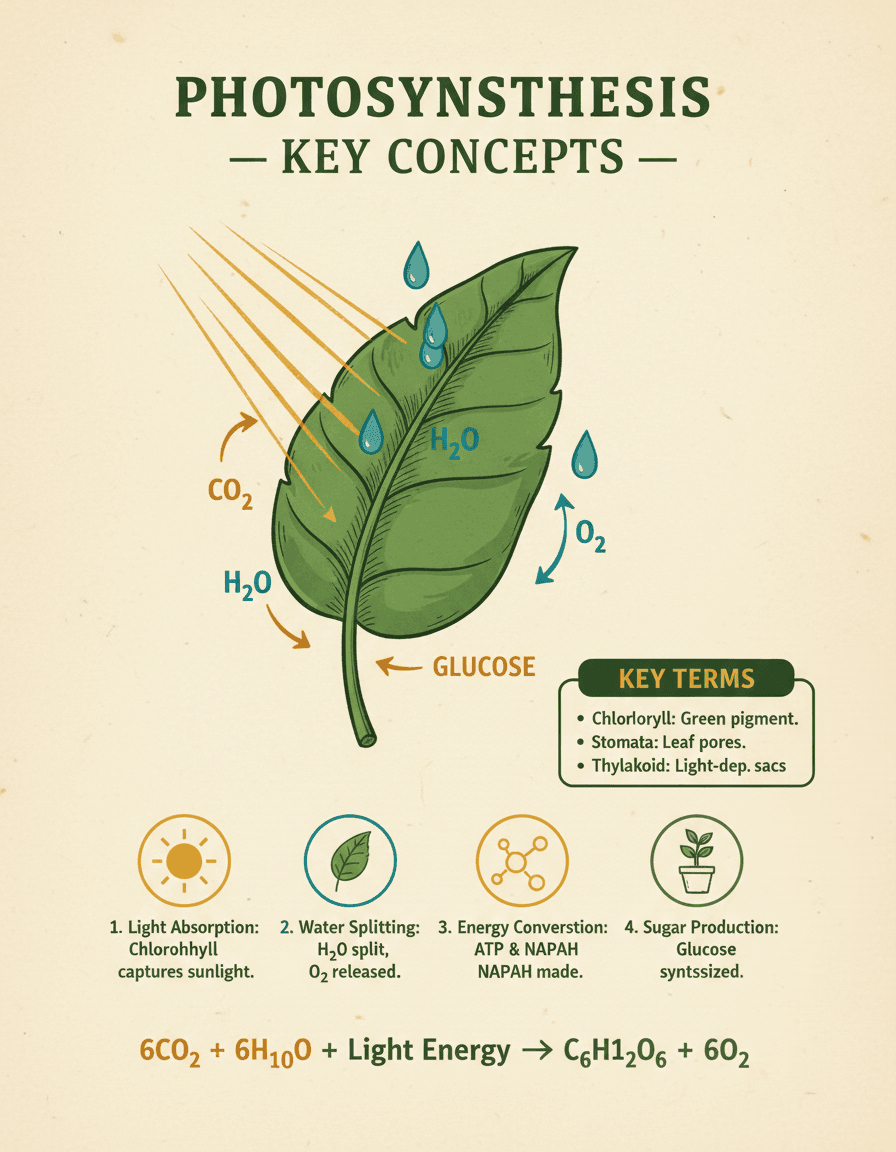
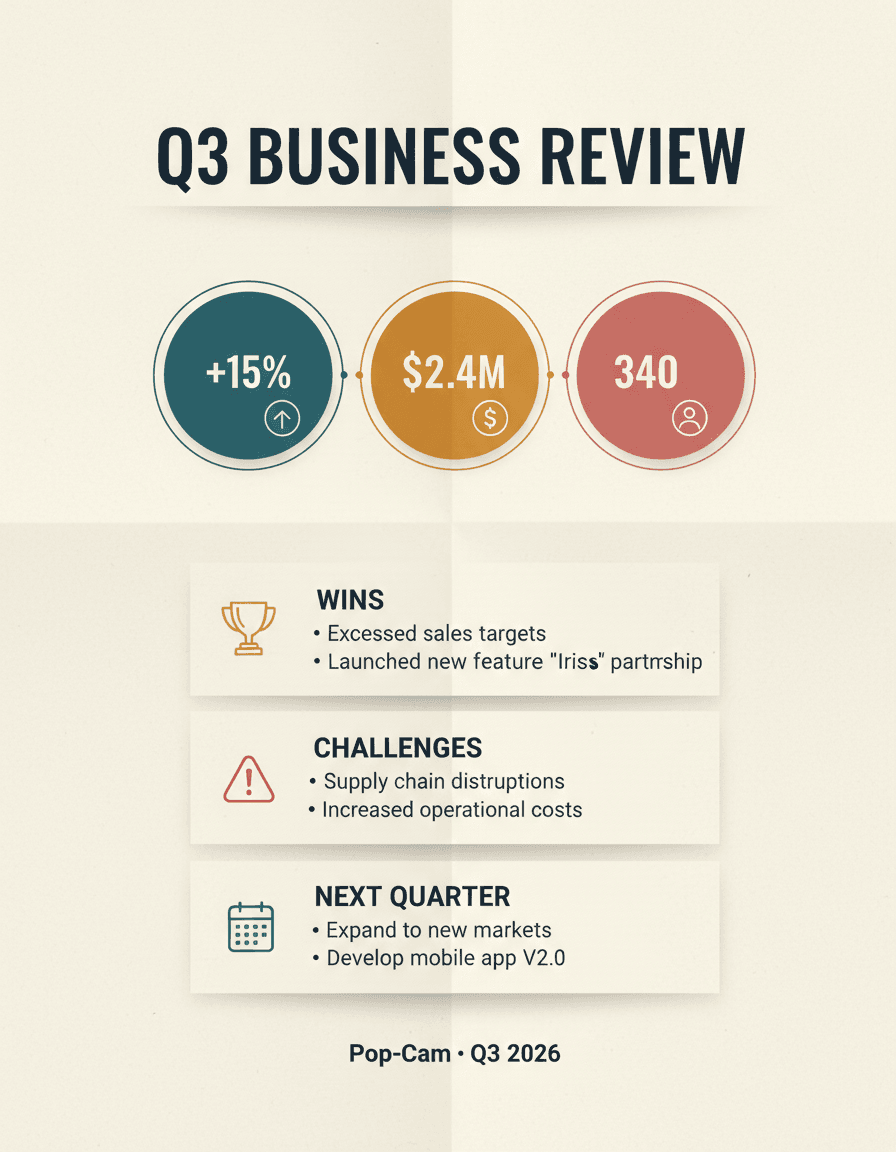
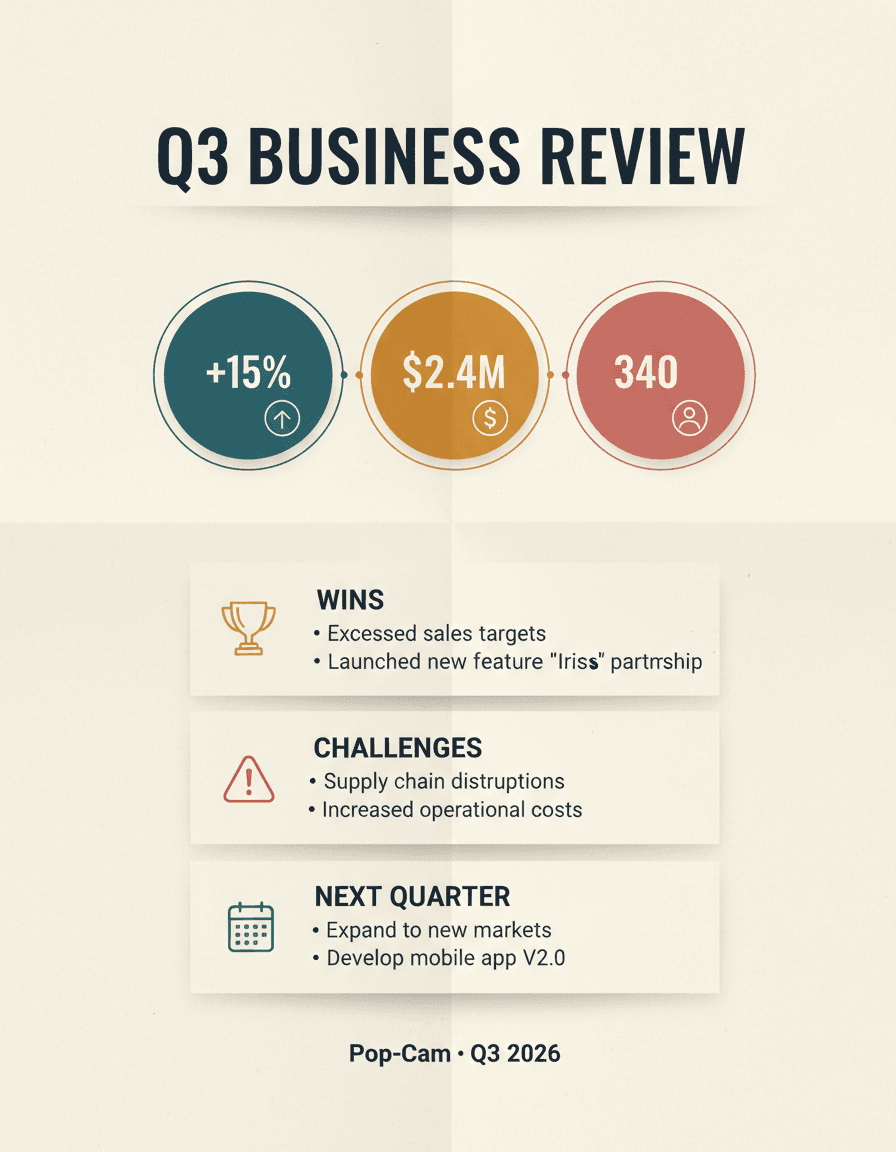
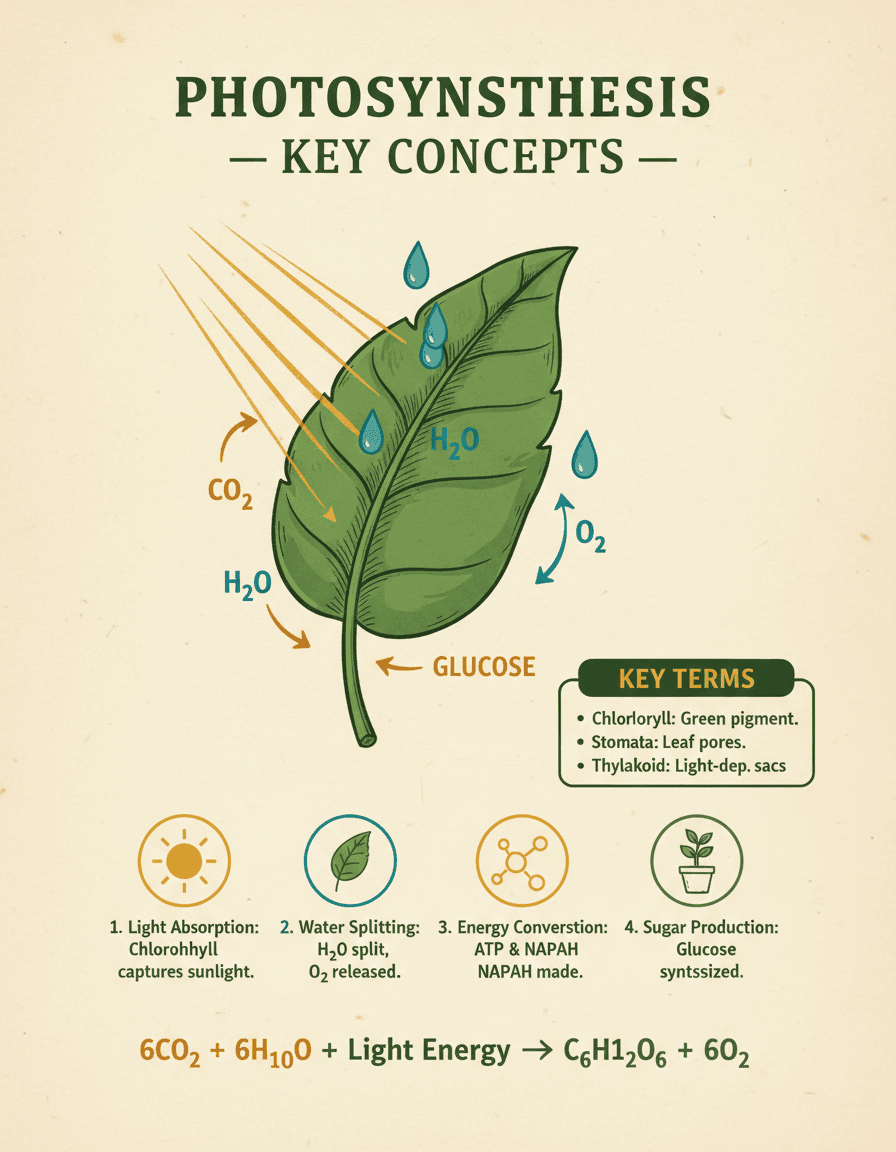
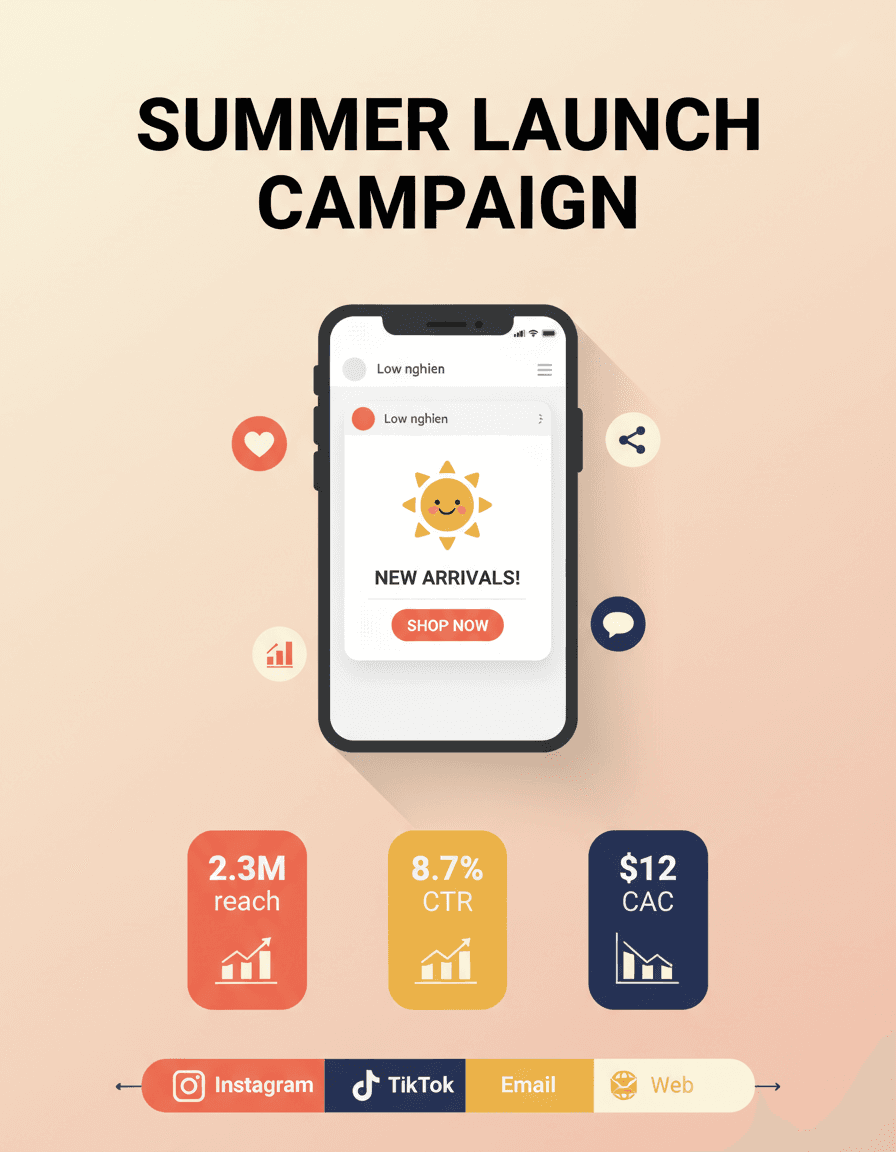
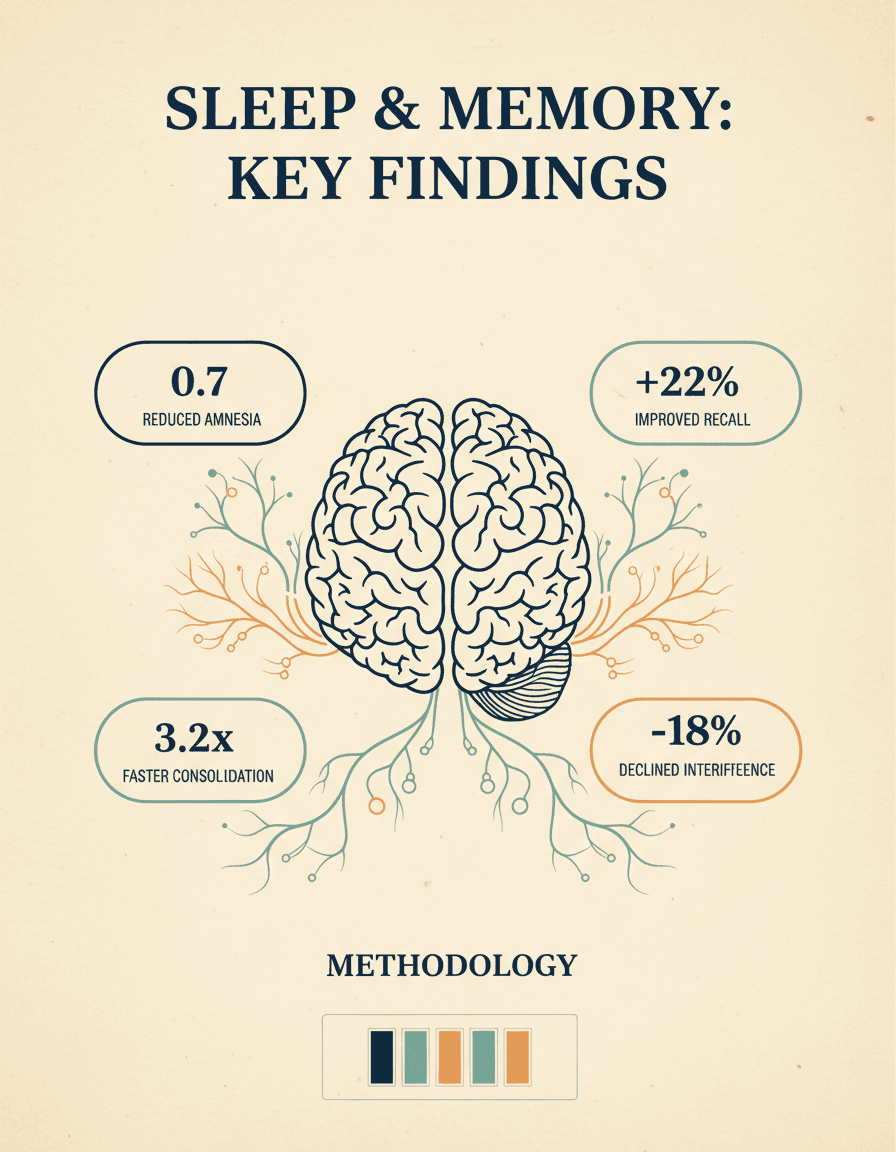
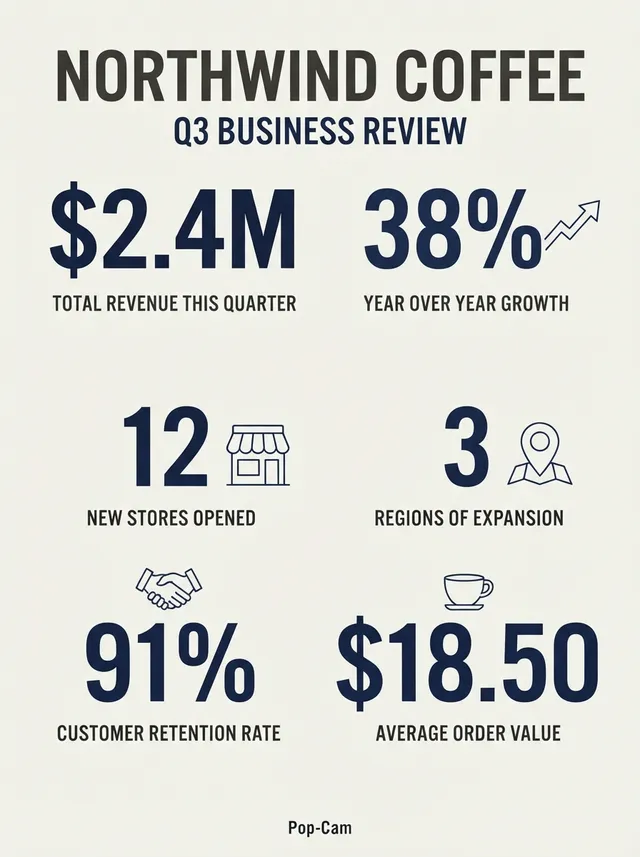
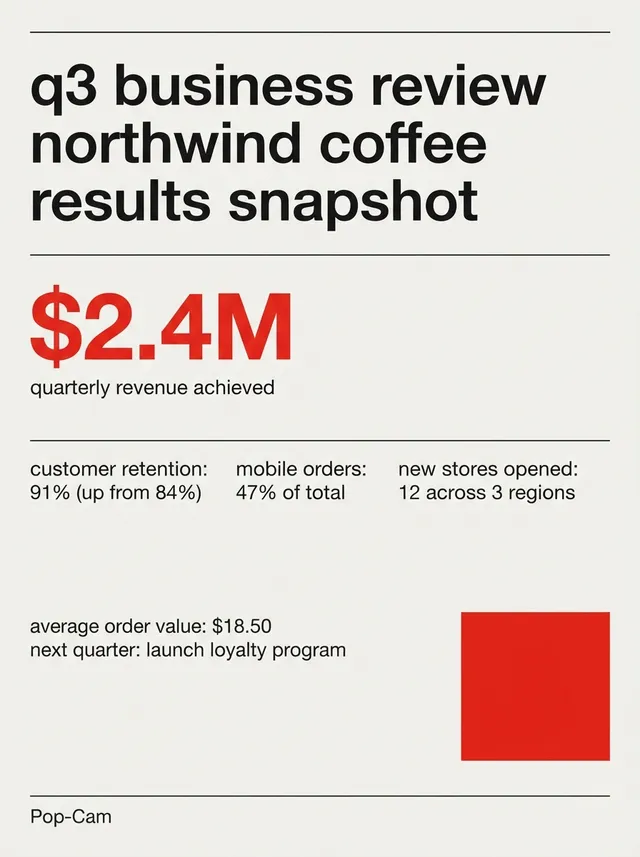
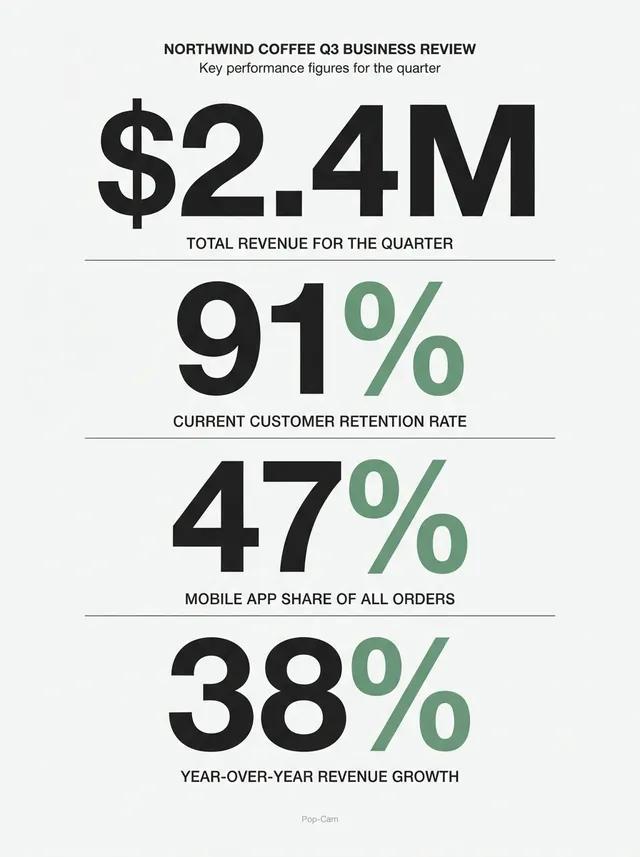
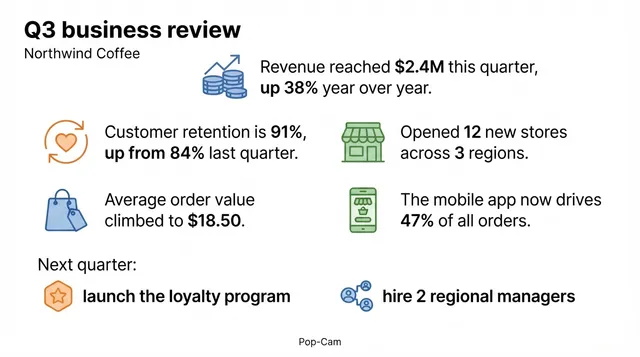
Four sets of notes, four posters
Every one of these started as plain text pasted into the box above.
Four styles, one set of notes
Pick the one that fits where the poster is going. The words stay the same; the typography, grid and accent change.
How it works
Paste your notes
Meeting notes, a study guide, a lecture summary or a project brief. Plain text, or drop a .txt or .md file. Up to 5,000 characters.
Pick a style and generate
The AI reads the text, decides what is the headline, what is a statistic and what is a caption, and draws the poster in about thirty seconds.
Edit, then download
The PNG downloads straight away. Press Edit to fix a number, drop a line or move things around, then regenerate.
What you get
Layout decided for you
Hierarchy, headings, numbers and accent colours are chosen by the AI. No templates to hunt through.
Works on any notes
Meeting notes, lecture summaries, study guides, briefs, book recaps, research highlights.
Sharp PNG export
Every infographic exports as a high-resolution PNG with no watermark. Fine on slides, social or print.
Free to try, no card
Your first infographic needs no sign-up. A free account comes with 2 free 💎 for more. Edits are free. No credit card.
Palettes that fit the topic
Calm tones for research, warm ones for marketing, high contrast for study guides.
Under thirty seconds
Faster than opening a design tool, picking a template and wrestling a layout into shape.
Most languages
Paste notes in English, Spanish, French, German, Japanese, Chinese and more. The text stays in your language.
Private by default
Notes are used for the single generation and are not stored or trained on.
Who it is for
Students
Lecture notes and study guides into one-page revision sheets that print to A4.
Teachers
Lesson plans and reading material into classroom handouts and visual summaries.
Marketers
Meeting notes, customer research and quarterly results into visuals for LinkedIn and Slack.
Researchers
Literature reviews and findings into clean visual abstracts for posters and supplements.
Content creators
Blog drafts, newsletter outlines and video scripts into thumbnail-ready summaries.
Consultants
Workshop output and strategy docs into one-pagers for readouts and proposal annexes.
Pop-Cam, Canva, ChatGPT, or by hand
| Feature | Pop-Cam | Canva | ChatGPT | By hand |
|---|---|---|---|---|
| Layout from raw text | ||||
| Time to first draft | About 30 sec | 10 to 30 min | Text only | 1 to 3 hours |
| Visual output | ||||
| Editable afterwards | ||||
| Design skill needed | None | Some | None | Yes |
What is a notes-to-infographic generator?
A notes-to-infographic generator is an AI tool that reads raw text (meeting notes, lecture summaries, study guides, project briefs, any unstructured writing) and turns it into a visual infographic. The AI makes the decisions a designer would normally make: which idea is the headline, what becomes a callout, where icons help, and which palette fits the topic. You paste, generate and download. The Pop-Cam generator runs in your browser: your first infographic is free with no sign-up, and a free account comes with 2 free 💎 for more, no credit card needed.
Why turn notes into infographics?
Visual notes are easier to scan, remember and share. People recall visual content better than walls of text, which is why teachers, marketers and consultants spend hours every week converting written material into slides and one-pagers. An AI infographic collapses that hour into thirty seconds. Use it to:
- Summarise meeting notes into a Slack recap your team will actually read.
- Turn lecture notes into a study guide for exam prep.
- Repurpose a quarterly review into a LinkedIn-ready visual.
- Distil a research paper into a one-page visual abstract.
- Convert a podcast outline or video script into a thumbnail-ready summary.
How AI infographic generation works
The generator does three jobs at once. It parses your notes for structure: the implicit headlines, sub-points, numbers and supporting details. It chooses a visual hierarchy to match, a headline format for an executive summary, a stepped layout for a process, a split for a comparison. Then it renders the image with a coordinated palette, iconography and type sized for legibility. The editor adds a fourth step: it finds every block on the finished poster so you can move, retype or remove it, and regenerate.
Best practices for visual note-taking
Cleaner input gives sharper infographics. A few tips:
- Lead with a clear topic line. The first sentence usually becomes the headline.
- Use short fragments, not paragraphs. “Q3 revenue $2.4M, +15% YoY, 340 new customers” renders cleaner than prose.
- Include numbers and percentages. Numerical data is highlighted automatically.
- Stay under 1,500 characters for one-page output. The tool accepts 5,000, but tighter input gives tighter visuals.
- Group related ideas. Keep facts about the same topic adjacent so the AI can cluster them.
From a PDF, a document or plain notes
Have a PDF or a long document? Copy the relevant excerpt and paste it in. The free tool accepts any plain text up to 5,000 characters in English, Spanish, French, German, Japanese, Chinese and other major languages. For larger documents, brand colours, custom prompts and unlimited generations, Pop-Cam 💎 packs start at $6 for 24 generations.
Notes to Infographic FAQ
Yes. Your first infographic is free with no sign-up. Make a free account (no credit card) and you get 2 free 💎 for more, and editing your infographics is free. Need more? Pop-Cam 💎 packs start at $6 for 24 generations.
Not for your first one: you can make one infographic with no sign-up. After that, a free account (an email, no credit card) comes with 2 free 💎, 1 per infographic. If you want unlimited generations, custom prompts, brand colours or commercial rights, grab a 💎 pack at /checkout.
Yes. Press Edit on the result to open the editor. Every block of the poster (titles, numbers, captions, icons) becomes its own object you can move, resize, delete or retype, and you can change the background colour. When the words are right, Regenerate rebuilds the poster in the same style. Regenerating counts as a new infographic.
Free generations export as high-resolution PNG, from the generator and from the editor. Paid Pop-Cam 💎 users can additionally request transparent backgrounds, larger sizes and JPEG variants in the full Pop-Cam editor.
Yes. Notes are processed for the single generation and are not stored, indexed or used to train models. You can paste confidential meeting notes or sensitive study material without leaving a footprint.
Free-tier infographics are licensed for personal and small-publisher use: newsletters, classroom handouts, social posts. For full commercial rights (agency client work, paid sponsorships, ads, merchandise) sign up for a paid Pop-Cam 💎 pack at /checkout.
Canva and PowerPoint hand you a blank canvas: you still pick a template and lay it out. Pop-Cam works the other way round. You paste only text and the AI makes every layout decision. Use Pop-Cam when you do not have the time or the design skill to lay it out yourself.
ChatGPT outputs text. Pop-Cam outputs a finished infographic image. If you want words, use ChatGPT. If you want a one-page visual you can drop into Slides, Slack or a handout, use Pop-Cam.
Yes. The free tool works on any modern phone or tablet. Paste from your clipboard, tap Generate, and the infographic downloads as a PNG to your device. The editor is easiest on a larger screen.
Up to 5,000 characters per generation. For best results keep notes under 1,500 characters with short bullet-style fragments. Numbers, percentages and clear headlines render best.
Copy the relevant excerpt from your PDF and paste it into the input box. The free tool works with any plain text. For direct PDF upload, larger documents and batch processing, use the full Pop-Cam editor with a 💎 pack.
English, Spanish, French, German, Japanese, Chinese, Korean, Italian, Portuguese and Russian. Paste notes in your language and the AI keeps the language while rendering the visual.
No. Final image downloads from the Pop-cam website have no added visible watermark. Mascot Logo and Geometric Logo show watermarked previews. Use 💎 to unlock their clean files.
Your first infographic is free
Your first 2 generations are free, no sign-up needed; sign up free to download them. Edits included, no card.
Try it freeExplore more Pop-Cam tools

Blog Header Image

3D Logo Maker

Y2K Camera Effect
3D Figurine From Photo

Nano Banana AI
Prompt Showcase
AI Pet Portrait

Dog Cartoon Generator

Cat Drawing Generator

Food Illustration

AI Outfit Illustration
AI Outfit Changer
AI Hairstyle Changer

Chibi Maker

Change Camera Angle

Mascot Logo Generator
Geometric Logo Maker

Sticker Generator

Y2K Logo Maker

Old Photo Restoration

Photo to Coloring Page
Googly Doodle Filter

AI Halloween Costume

AI Thanksgiving Photos

AI Christmas Card
AI Photoshoot Generator

AI Christmas Photos

Photo Background Changer

AI Text Remover